Dear Friends,
I hope this email finds you and your families enjoying the summer, wherever you may be!
Brown Harris Stevens has issued its Second Quarter Manhattan Residential Market Report for 2023, offering an in-depth look at residential sales trends in Manhattan for the past quarter.
Overall, both average and median sale prices softened 2% compared to the same quarter last year, a decrease we can attribute to a big pull back in market activity dating back to Q2 of 2022. As interest rates and inflation climbed dramatically accompanied by sensational headlines about a volatile stock market, the explosive momentum of the post-pandemic market considerably cooled down. The ensuing softening in the real estate market is well-embodied in the data contained within this report as year-over-year the number of closings decreased about 35% to 2,899 closings in Q2 2023 from 4,484 closings in Q2 2022.
That said, the market has seen improvement in the past weeks so I wanted to supplement these Q2 analyses with data that give you enhanced real-time indication of market activity in the now. Accordingly, you'll find below additional data from Brown Harris Stevens' July Inventory Report which was just released on Thursday, as well as data on signed contracts for the Upper Luxury segment of the market ($4M+) from the Olshan Report which I closely monitor.
It is my hope that you will find this assembly of data points and ensuing analyses useful as you weigh your needs, be they immediate or just for information. In your review of the below, should you wish to receive any of the reports here referenced in their entirety, would like any further detail on the information here enclosed or have any needs or questions for which I can be of service, please don’t hesitate to call.
With all my best wishes,

The Overall Market
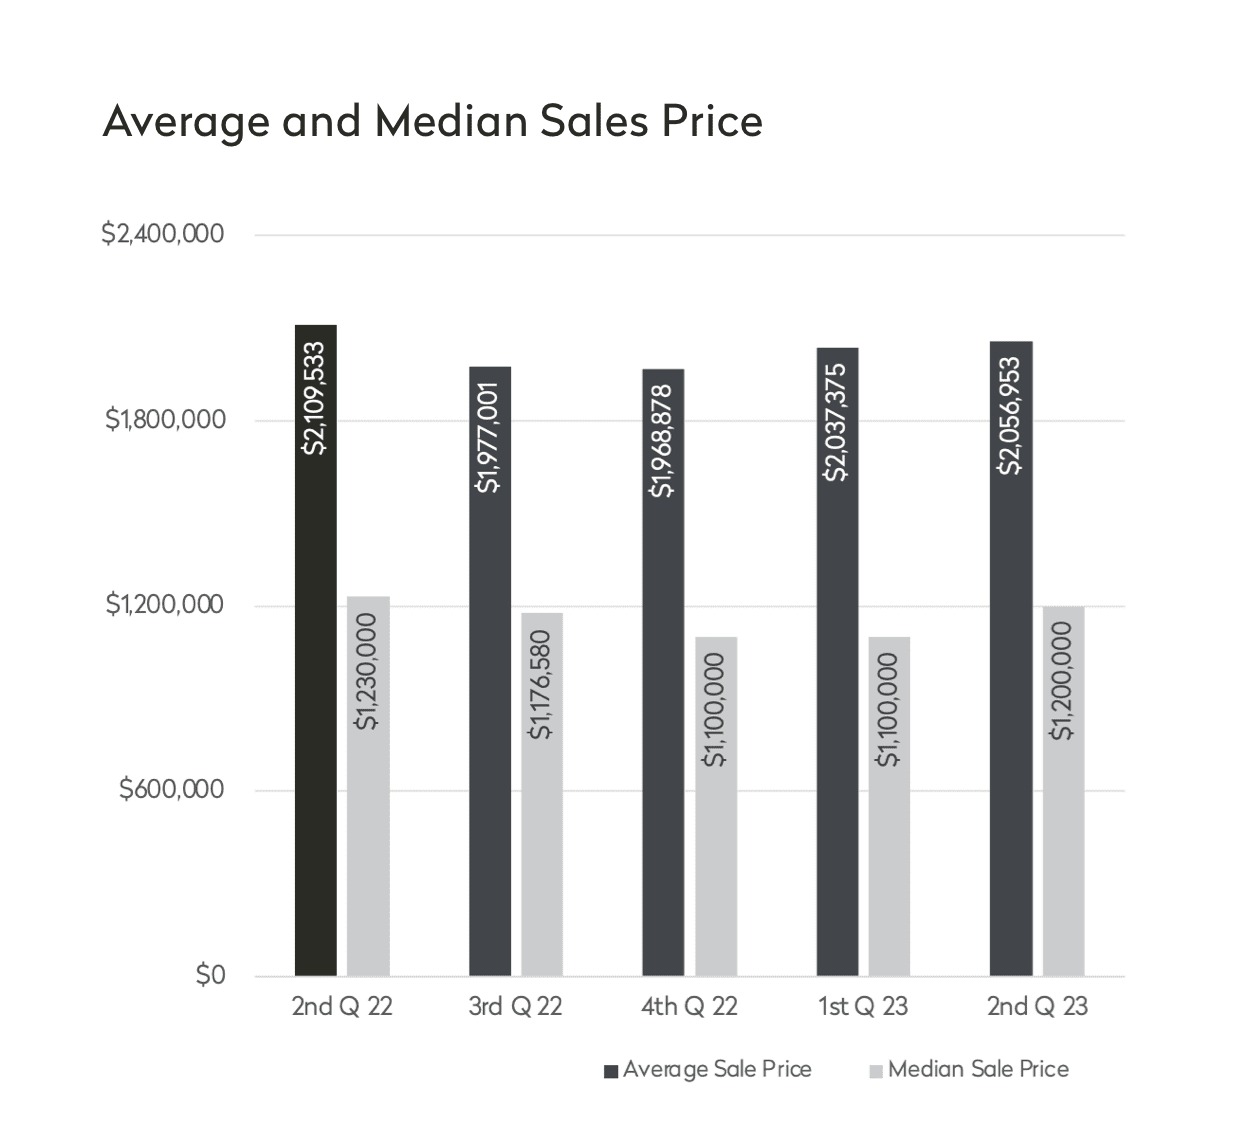
For Manhattan apartments, the average sales price was $2,056,953,787 in Q2 2023, down 2% from a year ago when it was $2,109,533. The median sales price also decreased 2% to $1,200,000 in Q2 2023 from last year when it was $1,230,000.
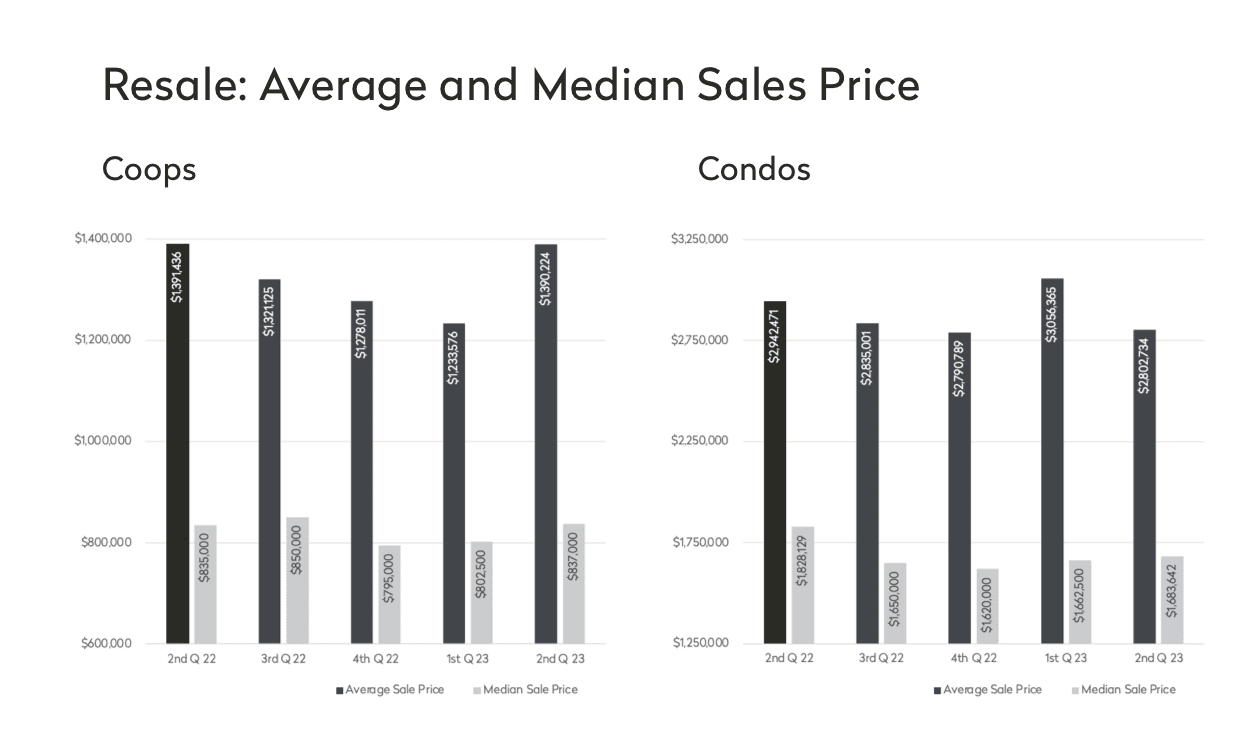
Cooperative average and median sales prices remained virtually unchanged in Q2 2023 compared to last year which isn’t surprising as coops tend to be more resistant to market shifts.
Condominium average and median sales prices slipped as prices fell both in New Development and Resale. The average condo sales price in Q2 2023 fell 4.7% to $2,802,734 from $2,942,471 last year. The median condo sales price fell 7.9% in Q2 2023 to $1,683,642 from $1,828,129 last year.
Although the average price for closings in New Development fell 9% to $3,370,202 from $3,701,040 last year, the Although the average price for closings in New Development fell 9% to $3,370,202 from $3,701,040 last year, the average New Development price per square foot remained virtually unchanged at $2,145 in Q2 2023 compared to $2,147 last year.
In Resale, co-op average sales prices increased slightly to $1,390,555 in Q2 2023 from $1,377,649 last year with almost every size category posting increases with the exception of studio apartments. Resale condo average sales prices fell 6% to $2,213,517 in Q2 2023 from $2,359,916 last year. 3+ Bedroom resale condos saw their prices decrease 7% to $5,062,252 from $5,431,725.
There were 2,899 closings in Q2 2023 which is 35% decrease from a year ago when there were 4,484 closings. While that may seem like a big drop, it’s important to note that last year’s data represented the tail end of a period of record-setting levels of activity that characterized our market post-pandemic. Since the economic shifts that began taking place in the second half of 2022, we have of course seen a corresponding pullback in market activity.
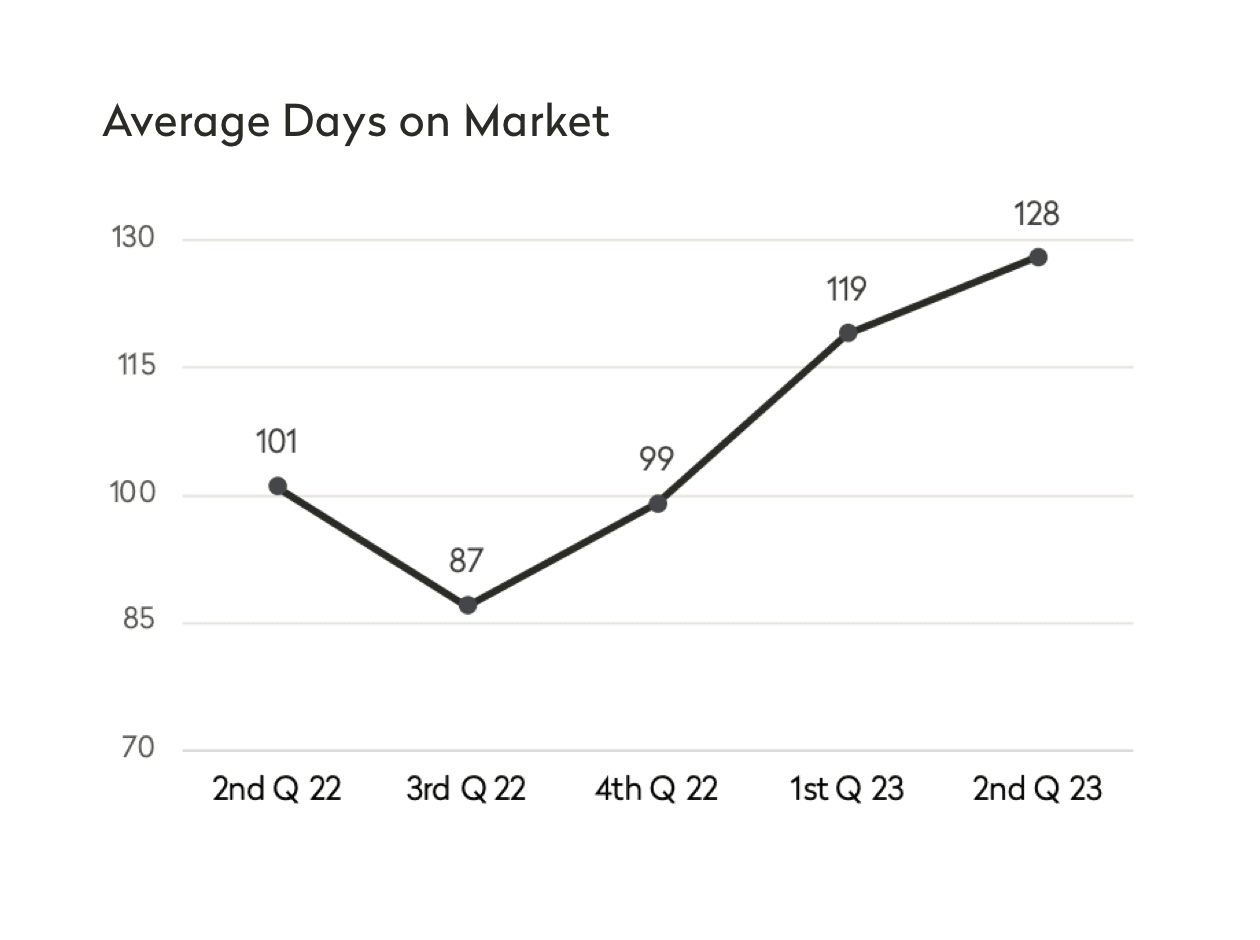
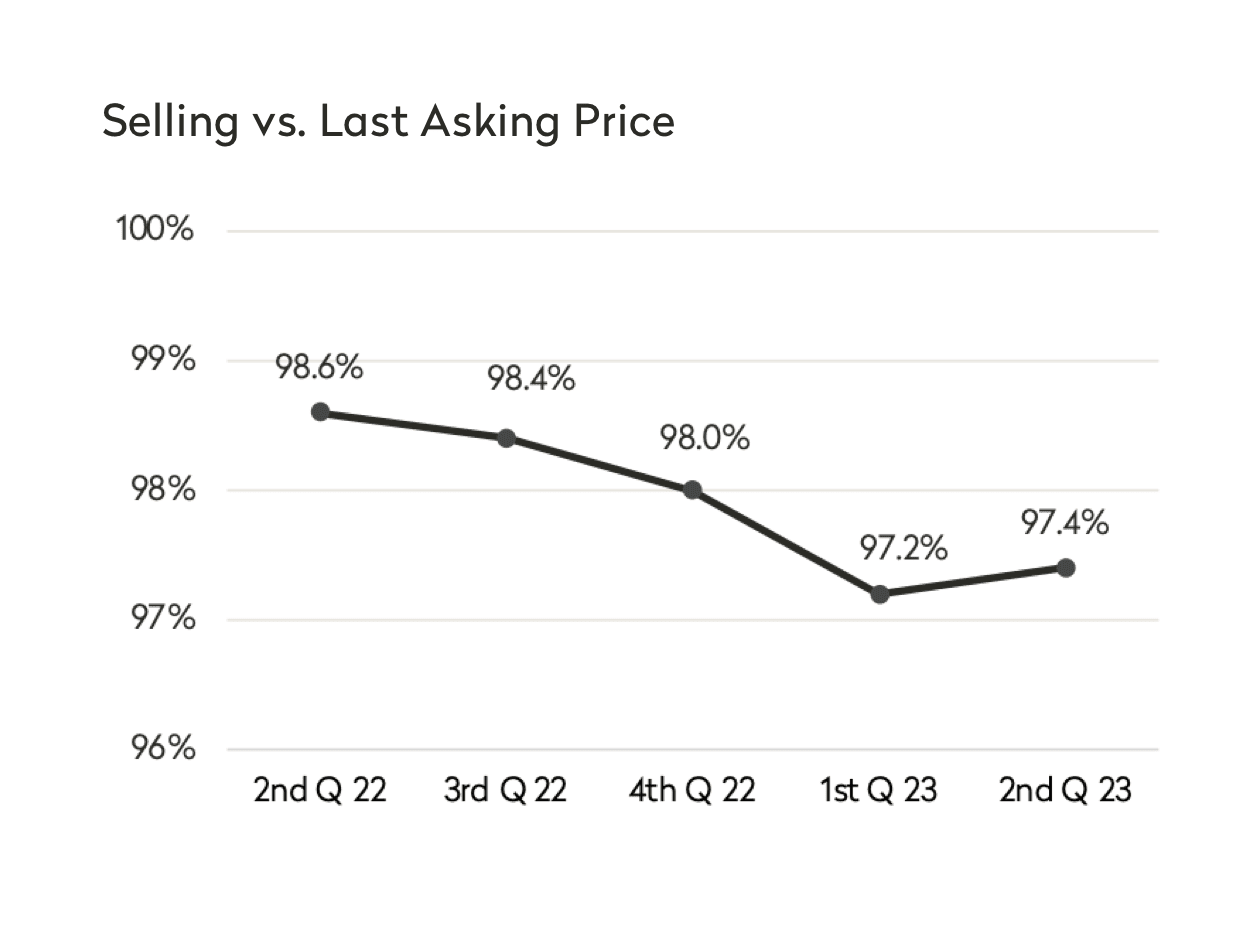
That said, it’s important to note here the average number of days on market in Q2 2023 rose to 128 days, representing a 27% increase from a year ago and the highest figure in two years. It’s therefore not surprising that buyers in Q2 2023 paid on average 97.4% of last asking prices as seller negotiability increased, motivated by this rise in time on market and increased competition.
Upper Luxury: $4M+
As for the Upper Luxury Segment of the market, we are seeing more contracts for apartments listed at $4M and up now than we saw last year at this time. While quarterly data is a lagging indicator, data on contract signings offer us a real-time snapshot into the health of the market right now. So far, July has seen 69 contracts signed in the Upper Luxury Segment, a considerable difference from last year when there were 56 contracts signed in the wake of big stock market dips and headlines about inflation.
Last week (7/17 – 7/23) saw an asking price volume of $162,460,000 and 22 contracts signed on listings over $4M, two fewer than the week before when there were 24 contracts signed.
Note that the week prior (7/10 – 7/16) saw an asking price volume of $246,959,000 which isn’t unusually high, but among the listings that secured signed contracts, the Olshan Report identified 10 listings (including one at the New Development I represent, 36A at 200 Amsterdam) priced $10M and above which was the most number of contracts signed at that price point (the “Trophy Segment”) since the last week of April when there were 11 contracts signed.
Inventory
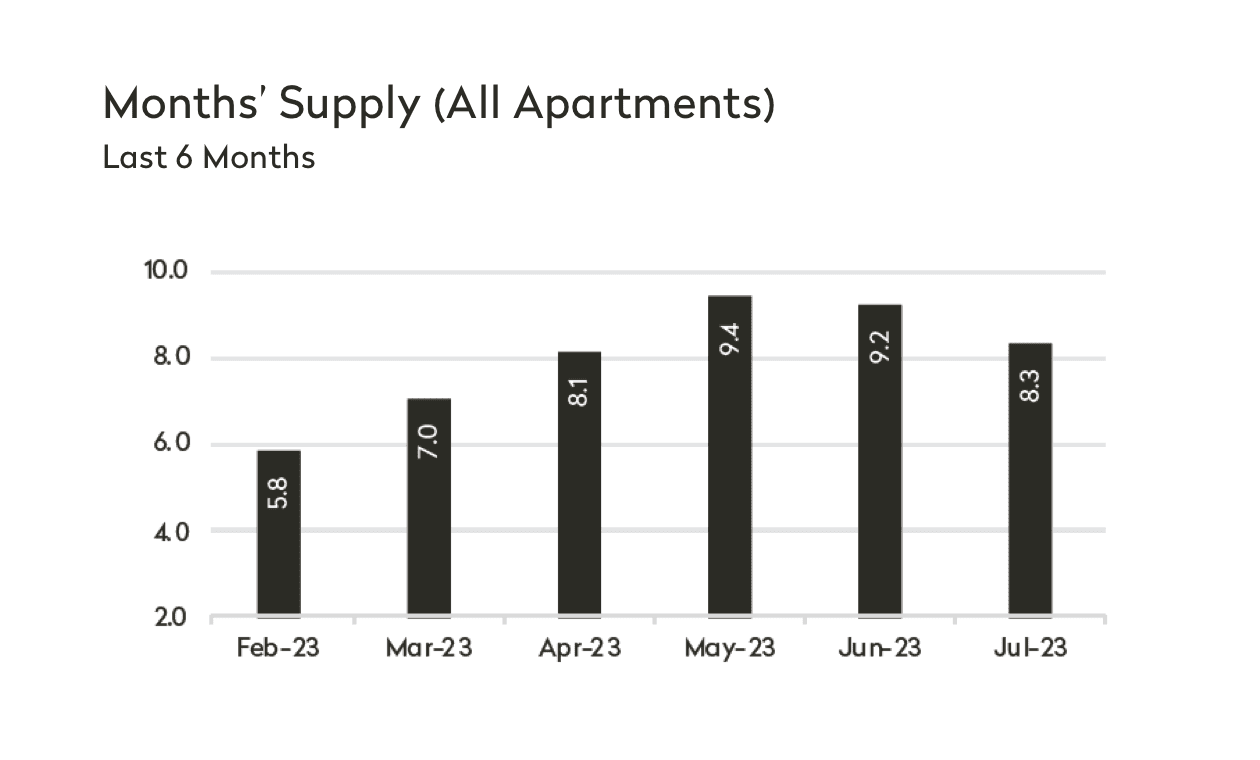
Brown Harris Stevens has also just issued its July Inventory Report, and the data shows a 10% decline in supply with a supply rate of 8.3 months from 9.2 months in June. For reference, a balanced market traditionally has a supply rate between 6 - 7 months.
While elsewhere in the country we have seen real estate values skyrocket due to limited supply, healthy levels of inventory in Manhattan have kept sellers negotiable and prices mostly stable.
A few highlights for you:
- The months' supply was 9.2 months for condos and 7.6 for co-ops. For reference, in July 2022 the supply rate for condos was 6.2 months and 5.1 months for co-ops.
- Supply was lowest on the West Side and Downtown between 14th and 34th Street at 7.2 months.
- The most oversupplied neighborhood was again Midtown West at 11.4 months.
Summary
In conclusion, while activity has slowed, our market has shown great resilience in the face of interest rate hikes and banking crises. With more and more of that behind us, the second half of the year looks like it could be promising as inflation data comes back better than expected and people go back to the office in higher numbers. While the market seems overall quiet this summer as people get back to seasonal travel, I do expect that we'll see activity predictably return come fall with new inventory and refreshed demand.
I so hope the above feedback has been useful to you, and please don’t hesitate to get in touch with questions or requests for copies of any of the reports referenced in this analysis. As you consider your needs, be they immediate or for continued information, I hope that you will continue to think of me as your expert and that you won’t hesitate to reach out to me with any real estate needs that you may have.
Warmly,